
High Housing Costs
Thania’s landlord overcharged her and then moved to evict her for rent she did not owe. LSC grantee Legal Services…
Thania’s landlord overcharged her and then moved to evict her for rent she did not owe. LSC grantee Legal Services…
Low-income Americans did not receive any or enough legal help for 92% of their civil legal problems. Watch this video…
The 2022 Executive Summary provides key toplines from 2022 Justice Gap Study report, which revealed that 92% of the civil…
This infographic presents data from the 2021 Justice Gap Measurement Survey specific to low-income households with recent domestic violence survivors.

This infographic presents data from the 2021 Justice Gap Measurement Survey specific to low-income rural households.

This infographic presents data from the 2021 Justice Gap Measurement Survey specific to low-income households with high housing costs (spending…
This infographic presents data from the 2021 Justice Gap Measurement Survey specific to low-income senior households.
This infographic presents data from the 2021 Justice Gap Measurement Survey specific to low-income veteran households.
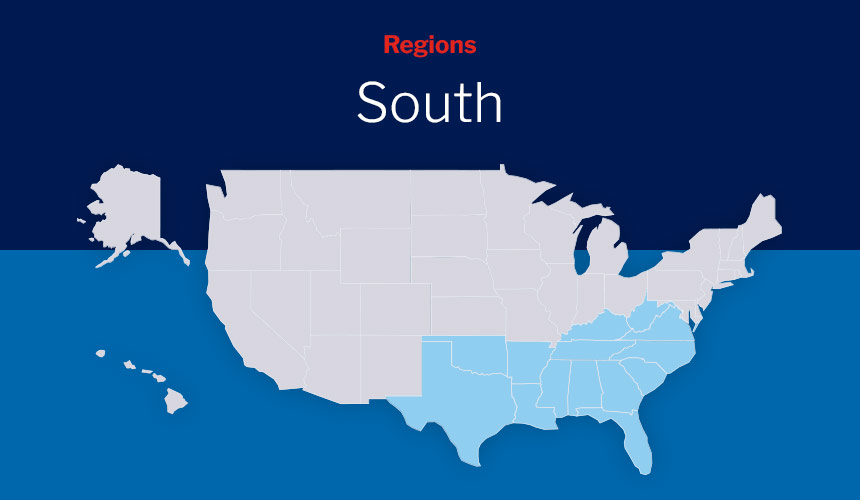
This infographic presents data from the 2021 Justice Gap Measurement Survey specific to low-income households in the South.
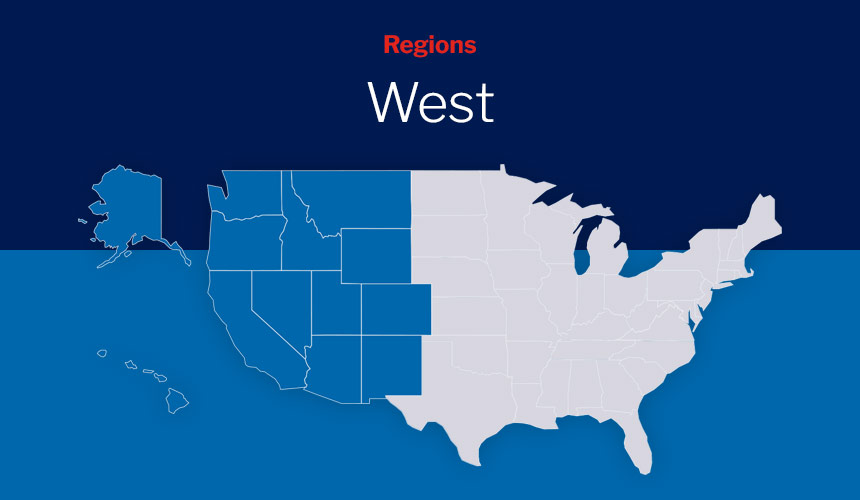
This infographic presents data from the 2021 Justice Gap Measurement Survey specific to low-income households in the West.
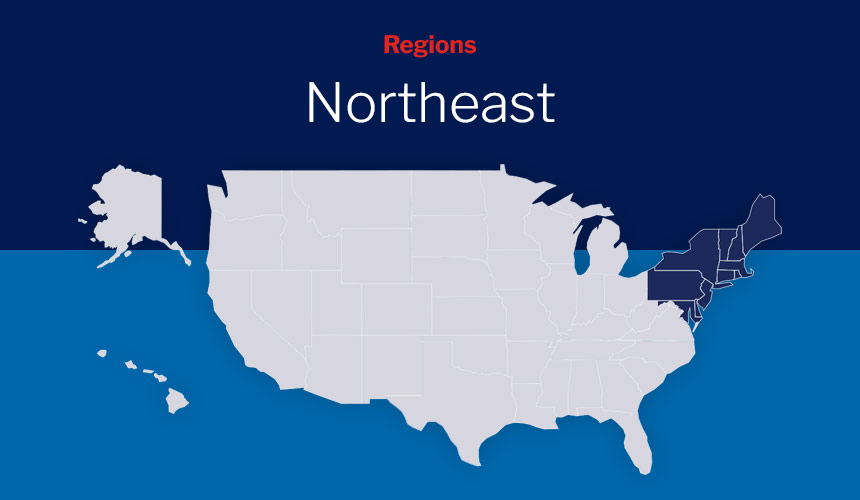
This infographic presents data from the 2021 Justice Gap Measurement Survey specific to low-income households in the Northeast.
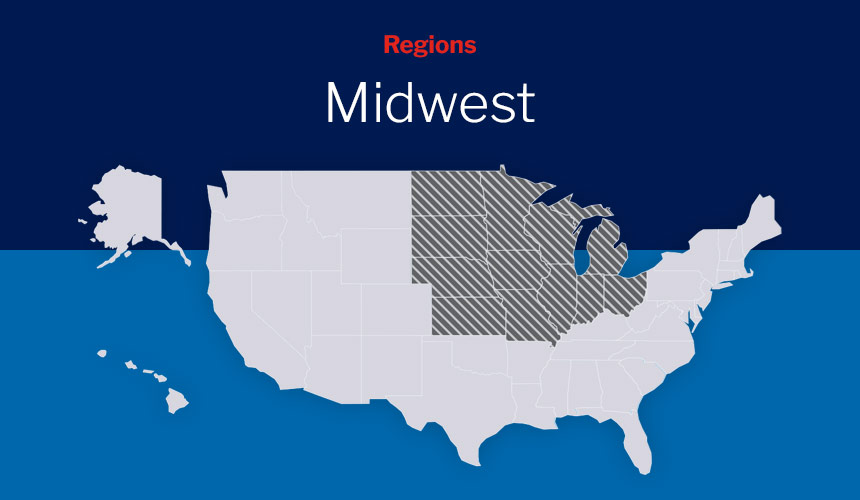
This infographic presents data from the 2021 Justice Gap Measurement Survey specific to low-income households in the Midwest.
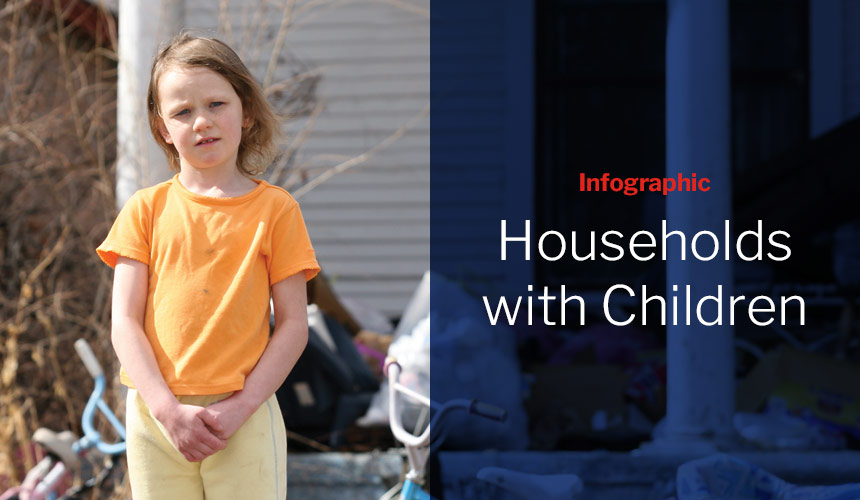
This infographic presents data from the 2021 Justice Gap Measurement Survey specific to low-income households with minor children.
The 2022 Justice Gap Study report, prepared by Mary C. Slosar, presents findings from the 2021 Justice Gap Measurement Survey…
The Justice Gap Measurement Survey Technical Report, prepared by NORC, details the survey methodology, summarizes the research findings, and provides…
The Justice Gap Measurement Survey Codebook, prepared by NORC, provides an overview of the survey methodology, describes the variables in…

The Justice Gap Measurement Survey Instrument, prepared by NORC, contains the text and organization of the questions as asked of…