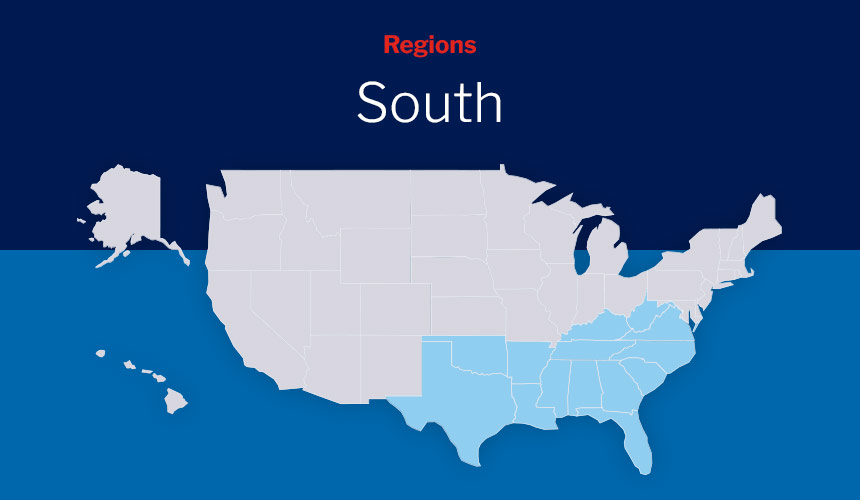
The South Infographic
This infographic presents data from the 2021 Justice Gap Measurement Survey specific to low-income households in the South.
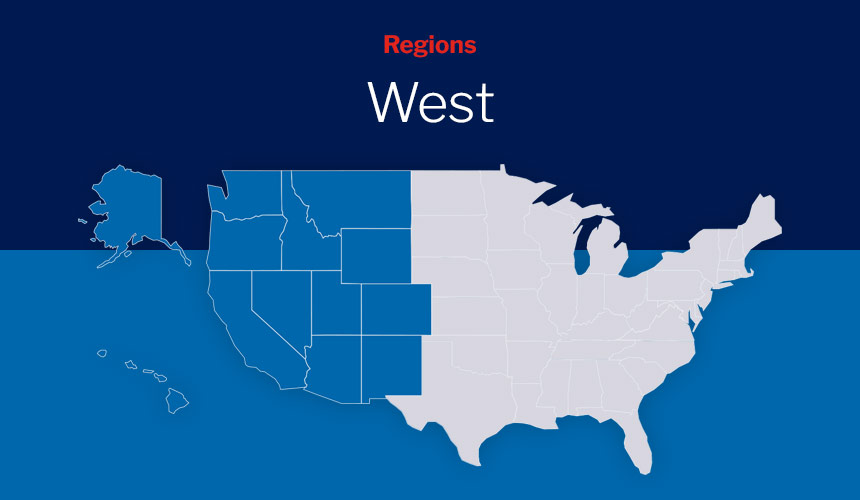
The West Infographic
This infographic presents data from the 2021 Justice Gap Measurement Survey specific to low-income households in the West.
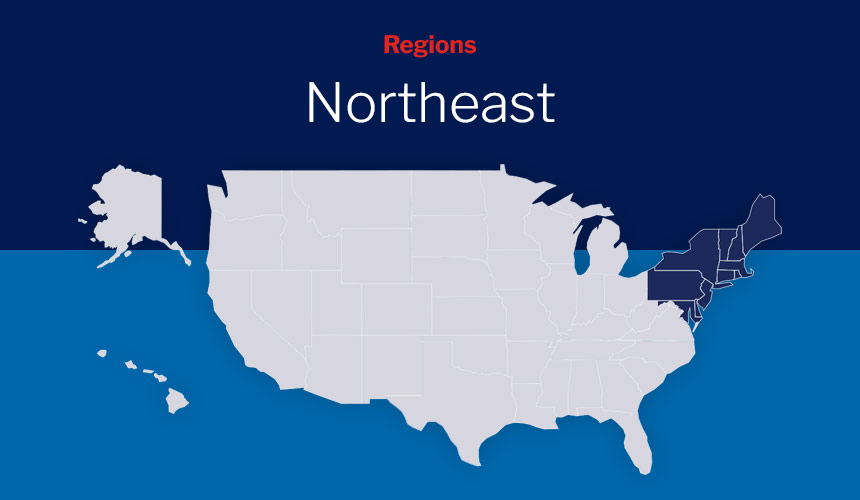
The Northeast Infographic
This infographic presents data from the 2021 Justice Gap Measurement Survey specific to low-income households in the Northeast.
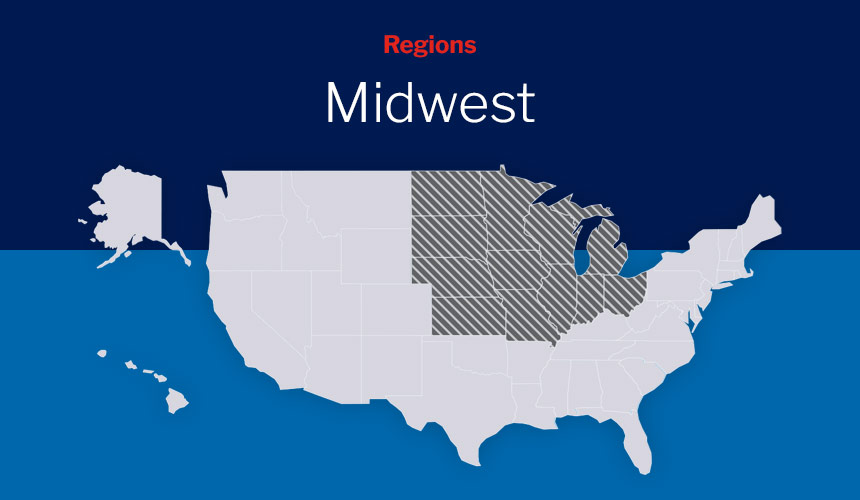
The Midwest Infographic
This infographic presents data from the 2021 Justice Gap Measurement Survey specific to low-income households in the Midwest.