About 50 million Americans have household incomes below 125% of poverty, including more than 15 million children.
In 2022, household incomes below 125% of poverty correspond to annual incomes below $34,500 for a family of four or $17,500 for an individual.7 Fifteen percent of Americans live in households with annual incomes below these levels. This translates to approximately 50 million low-income Americans, including approximately 15.2 million children (<18 years old).
Figure 2A. Low-income Americans’ share of state populations in 20218
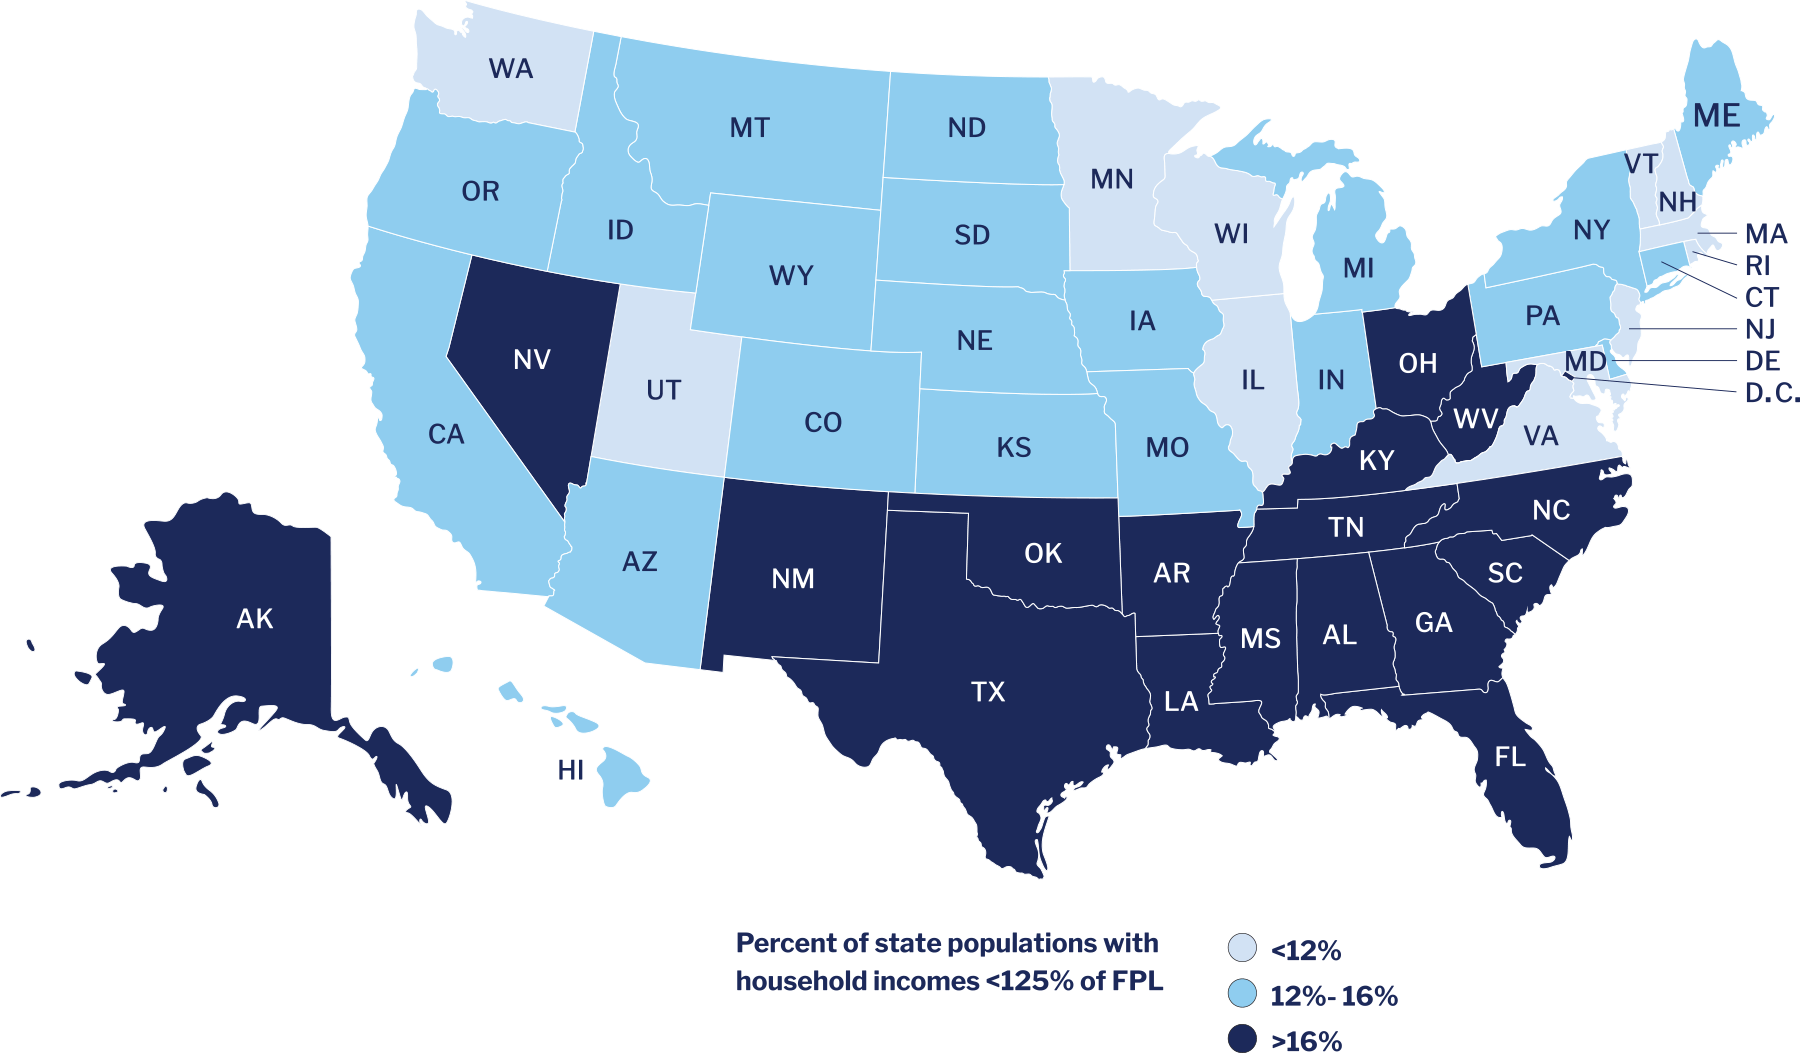
As Figure 2A above depicts, low-income Americans make up larger shares of some states’ populations than others. The states with the highest proportions of low-income residents include Mississippi (24%), New Mexico (23%), Louisiana (21%), and Oklahoma (20%). If we look at population counts (instead of proportions), the states with the largest populations naturally stand out as having the highest numbers of low-income residents. For example, California alone has about 5.9 million low-income residents, Texas has about 5.4 million, Florida has about 3.9 million, and New York has about 3 million.
About 50 million Americans have household incomes below 125% of the poverty threshold.
People living in rural areas are more likely to have low household incomes than people in other areas.
Most Americans live in suburban or urban areas,9 and those with low incomes are no exception. Combined, suburban and urban areas are home to approximately 42 million low-income people whereas only about 8 million low-income people live in rural areas. Note, however, that this low population count for rural low-income Americans is driven by the fact that not many Americans live in rural areas more generally. As a matter of fact, people living in rural areas are actually more likely than others to have low incomes: 19% of the rural population has a household income below 125% of poverty compared to 15% of the combined suburban/urban population.10
Compared to non-Hispanic Whites, Blacks and Hispanics are more than twice as likely to have household incomes below 125% of poverty.
As Figure 2B shows, Blacks and Hispanics are much more likely to have low incomes compared with non-Hispanic Whites and Asian Americans. Indeed, more than one-quarter (26%) of all Blacks and nearly one-quarter (23%) of Hispanics live in households with incomes below 125% of poverty.
That said, given the relative sizes of the racial and ethnic groups in the United States, the low-income, non-Hispanic White population (~21.4 million) far outnumbers the size of the low-income populations among Hispanics (~14 million), Blacks (~11 million), and Asian Americans (~2.3 million).
Figure 2B. Proportion of racial/ethnic groups with household incomes below 125% of poverty11
Percent of U.S. racial/ethnic populations
One in five American children lives in a low-income household.
More than one-fifth (21%) of all American children live in households with incomes below 125% of poverty. This translates to about 15.2 million children in total. Additionally, children are disproportionately represented in the low-income population compared to the general population. See Figure 2C which presents the distribution of children under 18 years old, adults between 18 and 64 years old, and seniors (65 years or older) for the low-income and general populations in the United States. As the figure shows, children make up a nearly one-third (31%) of the low-income population but less than one-quarter (22%) of the general population.
Figure 2C. Distribution of age: low-income versus general U.S. population12
Percent of individuals
Low-income population General population
21% of children in the U.S. live in households with incomes below 125% of the federal poverty level.
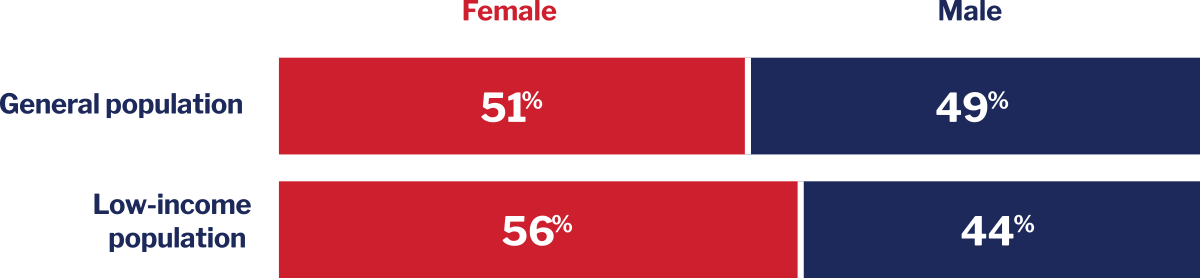
Low-income women and girls outnumber low-income men and boys in the United States.
There are approximately 5.7 million more women and girls with low incomes than men and boys. There are roughly 27.8 million women and girls, and roughly 22.1 million men and boys who live in low-income households. These numbers reflect the fact that women and girls are disproportionately represented in the low-income population (which is 56% female) compared to the general population (which is 51% female). See Figure 2D. Additionally, it is worth noting that a majority (58%) of all the low-income households with children are headed by single women.13
Figure 2D. Distribution of males and females: low-income versus general U.S. population14
Percent of individuals
Compared to the general adult population, low-income adults are disproportionately less likely to have a college degree and more likely to have never graduated high school.
Figure 2E presents the distribution of educational attainment for the general and low-income adult (18 years or older) populations in the United States. As the figure shows, one in five (20%) low-income adults has less than a high school education (or equivalent), which is more than twice the rate for the general adult population (9%). In the same vein, only 13% of low-income adults have a college education compared with 31% of the general adult population.
Figure 2E. Distribution of education: low-income population versus general U.S. population15
Percent of individuals
Low-income population General population
Impact of the COVID-19 Pandemic
The COVID-19 pandemic has had devastating and disproportionate effects on low-income Americans.
In addition to the direct health impacts of the COVID-19 virus on low-income families and communities,16 the pandemic has also had unprecedented consequences for their economic situations, housing security, mental health, physical safety, food security, access to education, and many other aspects of their lives.17
To provide a sense of some of the challenges low-income Americans still face a full two years into the pandemic, we share some results from the U.S. Census Bureau Household Pulse Survey’s most recent week of data collection at the time of writing this report (Week 43: March 2 – 14, 2022).18 The statistics below correspond to people with annual household incomes less than $25,000.
14% of the population in the midwest is below 125% of FPL.
9.2 million children and adults.
14% of the population in the northeast is below 125% of FPL.
7.4 million children and adults.
14% of the population in the west is below 125% of FPL.
11.1 million children and adults.
18% of the population in the south is below 125% of FPL.
22.2 million children and adults.
7.6 million seniors have household incomes below 125% of FPL.
8 million people living in rural areas have household incomes below 125% of FPL.
1.6 million veterans have household incomes below 125% of FPL.
15 million households with high housing costs have annual household incomes of less than $25,000.
15.2 million children live in households with incomes below 125% of FPL.
The rate of intimate partner violence for women is nearly 3 times higher among those in the lowest income quartile versus those in the highest.
Related Information