Prevalence of Civil Legal Problems
Most low-income American households faced one or more civil legal problems in the past year.
The 2021 Justice Gap Measurement Survey assessed the prevalence of 81 distinct civil legal problems among low-income households. The results indicate that an estimated 74% of low-income households experienced at least one civil legal problem in the past year – with many households dealing with multiple problems. As Figure 3A shows, about three in five (62%) households experienced two or more problems, about two in five (39%) experienced five or more, and a shocking one in five (20%) of all low-income households experienced 10 or more problems in the past year.
74% of low-income households experienced at least one civil legal problem in the past year.
Figure 3A. Number of civil legal problems experienced by low-income households in the past year21
Percent of low-income households | n=2,003
Types of Civil Legal Problems
Figure 3B presents the prevalence rates for the six most common types of civil legal problems among low-income households. The dark blue bars correspond to the proportion of all low-income households that experienced a given type of problem. The occasional red bars correspond to subpopulations of particular interest for a given type of problem. For example, the chart shows the percent of all low-income households that experienced a housing-related problem (33%) as well as the percent of renter households that experienced this type of problem (43%).
Figure 3B. Percent of low-income households experiencing common types of civil legal problems22
Percent of low-income households | n=2,003
The two most common types of civil legal problems among all low-income households relate to consumer issues and health care.
Other common types of civil legal problems relate to essential needs, such as income maintenance, housing, education, and family and safety.
43% of low-income, renter households experienced at least one civil legal problem related to housing in the past year.
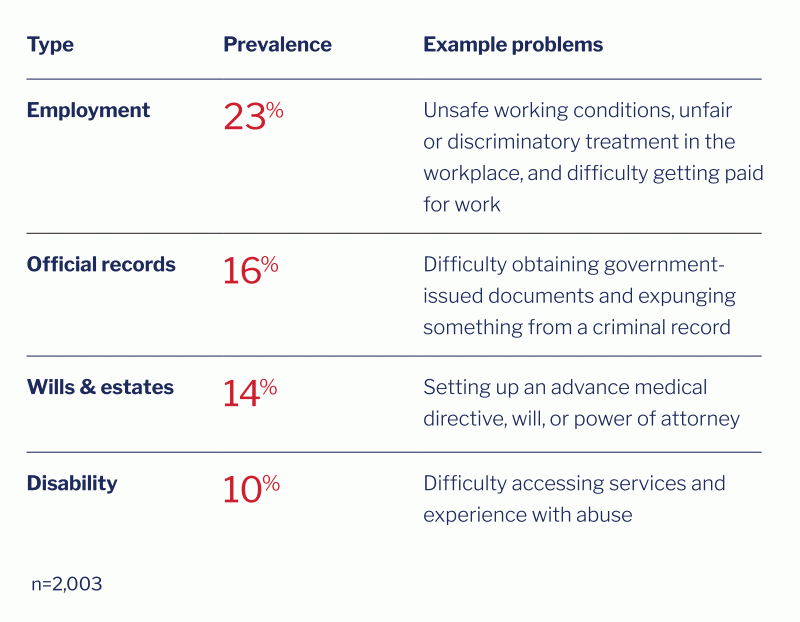
Table 3A. Additional types of civil legal problems experienced by low-income households24
Vicious Cycle of Civil Legal Problems
Households that experienced issues with eviction or domestic violence are disproportionately more likely to face multiple problems.
Consistent with other research about the dynamics of poverty and civil legal issues, the 2021 Justice Gap Measurement Survey finds that households that have to deal with certain types of issues tend to encounter even more problems.25 This pattern can feed a vicious cycle of civil legal problems that is difficult to interrupt without legal help. The survey data point to two poignant examples of this dynamic: households that have dealt with issues related to eviction and/or domestic violence are disproportionately more likely to have experienced multiple problems in the past year. See Figure 3C below.26
Figure 3C. Prevalence of civil legal problems for low-income households facing eviction and domestic violence27
Percent of low-income households
5 or more problems 10 or more problems
The Impact of Civil Legal Problems
In the past year, more than one-third of low-income Americans experienced a civil legal problem that substantially impacted their lives.
We consider a problem’s impact to be “substantial” if the respondent says the problem affected them “very much” or “severely” (as opposed to “moderately,” “slightly,” or “not at all”). The survey finds that more than one-third (38%) of low-income Americans personally experienced at least one civil legal problem that has had a substantial, negative impact on their household overall.
Figure 3D presents the percent of low-income Americans who experienced civil legal problems with a substantial negative impact in various aspects of their lives. As the figure shows, the most common impacts were on finances and mental health. Indeed, 35% report substantial impacts on their household’s financial situation, and 31% report the same for their or other household members’ mental and emotional health.
35% of all low-income Americans experienced a problem that has substantially impacted their household’s financial situation in the past year.
Figure 3D. Percent of low-income Americans experiencing civil legal problems with substantial impacts in various aspects of their lives28
Percent of low-income individuals | n=2,003
Problems relating to housing, employment, income maintenance, and family and safety stand out as the most impactful types of problems overall.
Narrowing our focus to only those low-income Americans who personally experienced problems in the past year (as opposed to all low-income), we see that more than one-half (55%) say at least one of their problems substantially impacted their lives overall. Some types of problems tend to impact people more than others. Figure 3E shows the percent reporting a substantial negative impact among those who personally experienced various types of problems. At least one-half of those personally affected by the following types of problems reported a substantial impact on their lives: housing (54%), family and safety (52%), employment (51%), and income maintenance (50%).
Civil legal problems had a substantial negative effect on 55% of those who personally experienced a problem in the past year.
Figure 3E. Percent of low-income Americans experiencing substantial impacts from civil legal problems, by problem type29
![]()
55%
All problems
(n = 1466)
![]()
54%
Housing
(n = 622)
![]()
52%
Family and safety
(n = 463)
![]()
51%
Employment
(n = 361)
![]()
50%
Income maintenance
(n = 585)
![]()
42%
Consumer issues
(n = 975)
![]()
40%
Education
(n = 316)
![]()
35%
Disability
(n = 165)*
![]()
35%
Official records
(n = 246)
![]()
30%
Health care
(n = 690)
![]()
20%
Wills and estates
(n = 180)*
Percent of low-income individuals who personally experienced at least one problem in a given category
* Small base size
Impact of the COVID-19 Pandemic
One-third (33%) of all low-income Americans personally experienced at least one civil legal problem related to the COVID-19 pandemic in the past year.
This translates to nearly one-half (47%) of all the low-income Americans who experienced one or more problems overall. Those most likely to experience a COVID-related problem track with our common understanding of who has been most affected by the pandemic. Among those that experienced at least one problem in the past year, those most likely to attribute their problems to the pandemic come from the following types of households: household in which someone struggles with substance use disorder (SUD) (64% attribute at least one of their problems to the pandemic), single-parent households (57%), households with children <12 years old (57%), and renter households (51%). See Figure 3F.
Figure 3F. Percent of low-income Americans attributing recent civil legal problems to the pandemic, by household characteristics30
![]()
47%
All individuals
(n = 1,466)
![]()
64%
From households with SUD
(n = 187)*
![]()
57%
From single-parent households
(n = 416)
![]()
57%
From households with children <12 yrs
(n = 552)
![]()
51%
From renter households
(n = 919)
Percent of low-income individuals who personally experienced at least one problem in a given category
* Small base size
The types of problems people are most likely to blame on the pandemic also track with our common understanding of how the pandemic has affected people. For example, respondents attribute nearly one-third (32%) of all their income maintenance problems to the pandemic, 31% of their education problems, and 27% of their housing problems. Looking at specific problems, more than one-half of low-income Americans attribute their problems related to unemployment benefits (52%) and eviction (56%) to the pandemic.
75% had 1+ problems.
45% had 5+ problems.
23% had 10+ problems.
74% had 1+ problems.
34% had 5+ problems.
15% had 10+ problems.
72% had 1+ problems.
38% had 5+ problems.
18% had 10+ problems.
75% had 1+ problems.
39% had 5+ problems.
21% had 10+ problems.
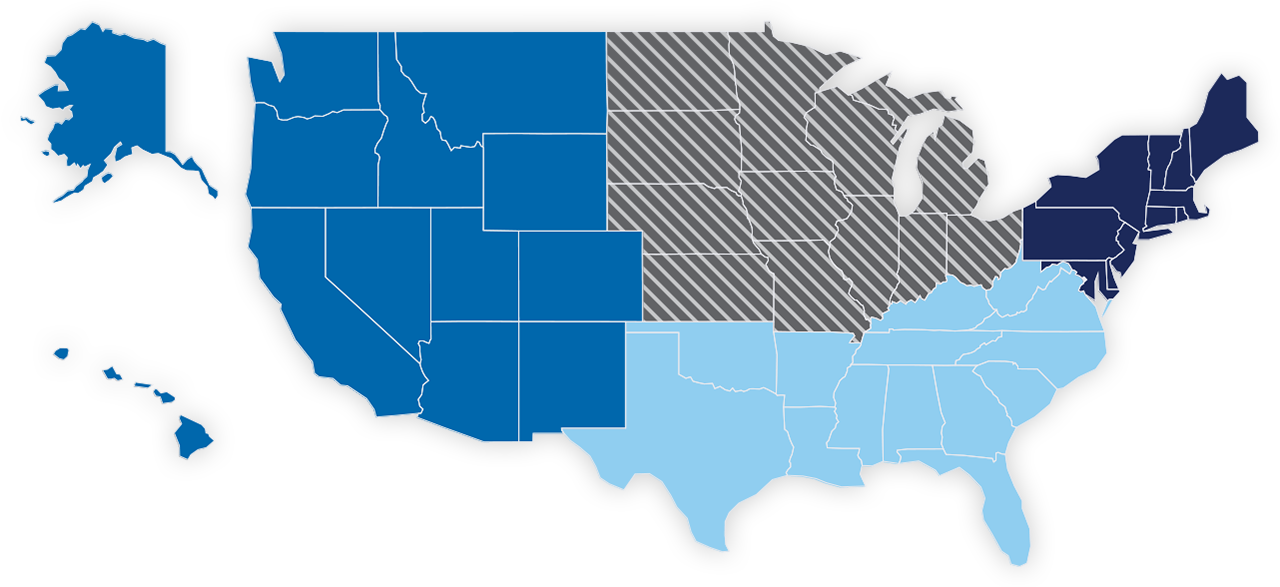
70% had 1+ problems.
31% had 5+ problems.
14% had 10+ problems.
77% had 1+ problems.
40% had 5+ problems.
23% had 10+ problems.
76% had 1+ problems.
44% had 5+ problems.
27% had 10+ problems.
84% had 1+ problems.
49% had 5+ problems.
26% had 10+ problems.
83% had 1+ problems.
52% had 5+ problems.
30% had 10+ problems.
98% had 1+ problems.
87% had 5+ problems.
62% had 10+ problems.
* These estimates exclude problems related to domestic violence.


