Comparing Income Groups
While the main focus of this study is to better understand low-income Americans’ civil legal needs, the 2021 Justice Gap Measurement Survey also included a nationally representative sample of individuals with household incomes above 125% of FPL. The primary purpose of this higher-income sample was to explore how experiences with civil legal problems might differ by income. For the purposes of this report, we group individuals into the following three categories based on their household income and household size:
- At or below 125% of FPL
- Between 125% of FPL and 400% of FPL
- At or above 400% of FPL
Table 5A presents the approximate annual incomes that correspond to each of these income groups for a typical family of four and a typical individual.56
Table 5A. 2022 annual household income levels for income groups of interest57
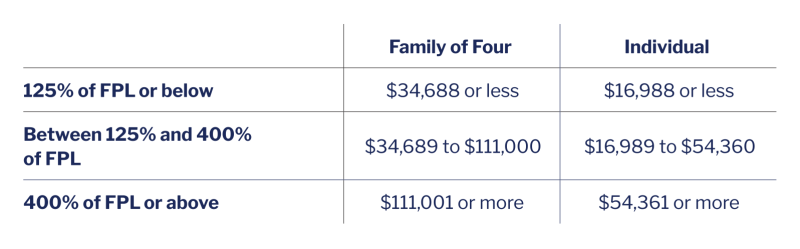
This section focuses primarily on comparisons between people at or below 125% of FPL (“low-income Americans”) and people at or above 400% of FPL (“higher-income Americans”). This offers the sharpest comparison given that household income often fluctuates, and people who are in the middle income group today could very well be in the lower or higher income group tomorrow.
Comparing Likelihood to Seek and Receive Legal Help
In general, the likelihood to seek legal help is higher for problems with substantial impact, and this pattern is more pronounced among people with higher incomes.
Table 5B summarizes each income group’s likelihood of seeking legal help in the past year for three groups of problems: all problems, problems with substantial impact, and problems with less impact. As the table shows, people are more likely to seek legal help for problems with substantial impact. We see this “impact differential” across all three income groups.
Table 5B. Percent of problems for which people sought legal help, by income58
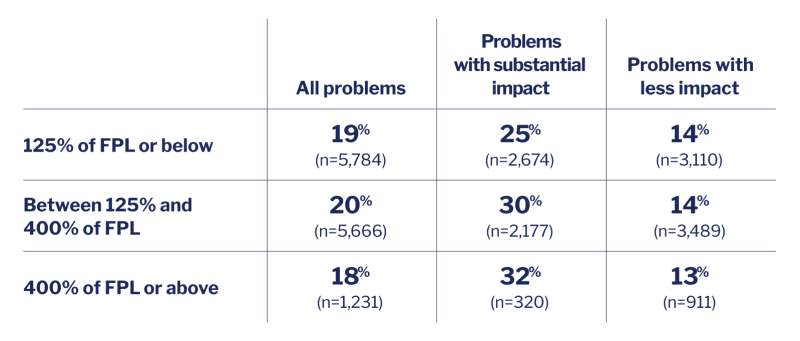
Figure 5A charts the impact differential for each income group’s likelihood to seek help; this is the difference between their likelihood to seek legal help for problems with substantial impact and those with less impact. As the figure shows, the impact differential is larger for people with higher incomes. For low-income Americans, the impact differential is 11 percentage points; they seek help for 25% of their problems with substantial impact and 14% of those with less impact. The impact differential for those at or above 400% of FPL is 19 percentage points; this group seeks legal help for nearly one-third (32%) of their problems with substantial impact and for 13% of those with less impact.
Figure 5A. Impact differential in likelihood to seek legal help, by income59
Percentage points
This impact differential is the difference (in percentage points) between the percent seeking help for problems with substantial impact versus problems with less impact.
Among higher-income Americans, the survey-based justice gap measure is significantly smaller for substantial problems.
Table 5C presents the survey-based justice gap measure for the three income groups. As a reminder, this measure reflects the percent of problems that do not receive any legal help or enough legal help. As the table shows, the survey-based justice gap measure for low-income Americans stays relatively flat regardless of impact level (94% versus 92%). Meanwhile, for those at or above 400% of FPL, it is significantly lower for problems with more impact (93% versus 78%). This translates to an “impact differential” of 15 percentage points for higher-income Americans compared to a differential of only three percentage points for low-income Americans. Figure 5B shows these impact differentials in chart form.
Table 5C. Percent of problems for which people did not receive any or enough legal help in the past year (i.e., survey-based justice gap measure), by income60
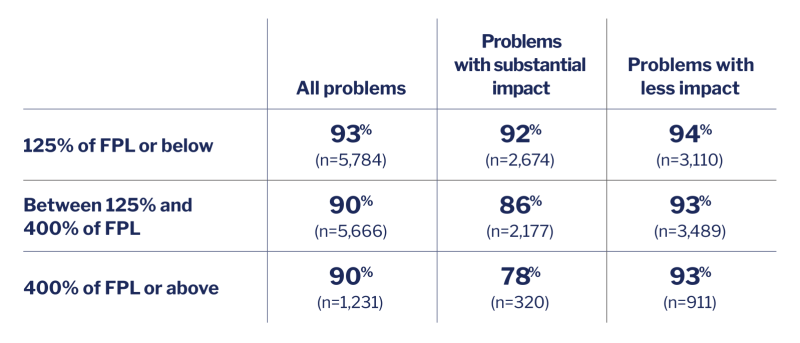
Figure 5B. Impact differential in survey-based measure of the justice gap, by income61
Percentage points
This impact differential is the difference (in percentage points) between the survey-based justice gap measure for problems with substantial impact versus problems with less impact.
Among higher-income Americans, the survey-based justice gap measure is smaller for problems with substantial impact; among low-income Americans, it stays the same no matter how impactful the problem might be.
Comparing Potential Barriers
Section Four of this report examined results for low-income Americans on survey measures that tap into three types of potential barriers: knowledge, attitudinal, and cost barriers. Below, we compare the results on the same measures for low-income Americans versus higher-income Americans. Overall, we find that higher-income Americans tend to have more positive attitudes toward the civil legal system and are more confident that they could find and afford legal help if they needed it.
The three income groups are similar when it comes to their likelihood to believe that a lawyer could help resolve their civil legal problems.
Figure 5C presents the survey results for all three income groups regarding whether they think a lawyer (or other legal professional) could help resolve their civil legal problems. Respondents answered this question for each of the problems they personally experienced in the past year. As the figure shows, there are only slight differences by income. Regardless of income, most Americans either did not think that lawyers could help them with these sorts of problems (44% to 47%) or they were not sure about it (19% to 30%).
Figure 5C. Beliefs about whether a lawyer could help resolve their civil legal problems, by income62
Percent of problems experienced
People with higher incomes tend to have more positive views of the civil legal system and how it relates to people like them.
Figure 5D presents the percent of individuals who agree with three statements about the U.S. civil legal system and how it might support “people like [them].” Overall, these results point to significant differences in attitudes about the civil legal system across income groups. Indeed, compared to low-income Americans, those at or above 400% of FPL are much more likely to agree with all three statements. We see the biggest differences with regard to the statement, “People like me are able to use the civil legal system to protect and enforce their rights” – with 59% of those at or above 400% of FPL agreeing versus 39% of low-income Americans.
Figure 5D. Percent agreeing with various statements about the U.S. civil legal system, by income63
Percent of individuals
<=125% of PFL (n=2,0003) >125% and < 400% of FPL (n=2,318) >= 400% of FPL (n = 987)
Compared to low-income Americans, those with higher incomes are generally more confident in their ability to find a lawyer that they could afford.
One of the most striking findings from Section Four of this report is the fact that fewer than one-half (45%) of low-income Americans expressed confidence in their ability to find a lawyer that they could afford if faced with a serious civil legal problem. Figure 5E presents the percent of individuals from all three income groups who express the same level of confidence (i.e., they are “somewhat,” “very,” or “extremely confident”). As the figure shows, nearly three-quarters (73%) of those at or above 400% of FPL say they are at least somewhat confident. This is a striking figure compared to that of the low-income group; indeed, higher-income Americans are a full 28 percentage points more likely than low-income Americans to express this confidence (73% versus 45%).
73% of higher-income Americans are confident in their ability to find a lawyer they could afford while only 45% of low-income Americans say the same.
Figure 5E. Percent confident in ability to find a lawyer they could afford, by income64
Percent of individuals
Impact of the COVID-19 Pandemic
Income disparities in the justice gap are exacerbated for civil legal problems related to the COVID-19 pandemic.
Compared to low-income Americans, those with higher incomes are less likely to have experienced a civil legal problem related to the COVID-19 pandemic. While one-third (33%) of low-income Americans experienced at least one problem related to
the pandemic, this is true for only 18% of those at or above 400% of FPL.65
Table 5C presents the survey-based measures of the justice gap for all problems with substantial impact – breaking them out by whether they were related to the pandemic.
Table 5C. Survey-based justice gap measure for pandemic-related and other problems with substantial impact, by income66

Looking at the column for pandemic-related problems, we see that this measure of the justice gap is much lower among those at or above 400% of FPL compared to low-income Americans. Low-income Americans do not receive any or enough legal help for 91% of the pandemic-related problems that substantially impacted them. Meanwhile, those at or above 400% of FPL do not receive any or enough legal help for 68% of these problems. This translates to an income disparity of 23 percentage points (91% versus 68%). Table 5C also makes clear that this income disparity is significantly greater for pandemic-related problems compared to other problems (23 versus 8 percentage points).
At or below 125% of FPL (n=534):
43% are confident.
Between 125% and 400% of FPL (n=558):
59% are confident.
At or above 400% of FPL (n=258):
76% are confident.
At or below 125% of FPL (n=257):
52% are confident.
Between 125% and 400% of FPL (n=284):
60% are confident.
At or above 400% of FPL (n=177)*:
71% are confident.
At or below 125% of FPL (n=402):
40% are confident.
Between 125% and 400% of FPL (n=529):
59% are confident.
At or above 400% of FPL (n=253):
70% are confident.
At or below 125% of FPL (n=810):
47% are confident.
Between 125% and 400% of FPL (n=947):
58% are confident.
At or above 400% of FPL (n=299):
74% are confident.
*Small base sizes
At or below 125% of FPL (n=369):
60% are confident.
Between 125% and 400% of FPL (n=481):
72% are confident.
At or above 400% of FPL (n=128)*:
87% are confident.
At or below 125% of FPL (n=419):
45% are confident.
Between 125% and 400% of FPL (n=412):
56% are confident.
At or above 400% of FPL (n=93)*:
77% are confident.
At or below 125% of FPL (n=242):
51% are confident.
Between 125% and 400% of FPL (n=416):
69% are confident.
At or above 400% of FPL (n=174)*:
76% are confident.
At or below 125% of FPL (n=826):
40% are confident.
Between 125% and 400% of FPL (n=617):
51% are confident.
At or above 400% of FPL (n=82)*:
53% are confident.
At or below 125% of FPL (n=889):
40% are confident.
Between 125% and 400% of FPL (n=918):
53% are confident.
At or above 400% of FPL (n=252):
70% are confident.
At or below 125% of FPL (n=177)*:
45% are confident.
Between 125% and 400% of FPL (n=112)*:
48% are confident.
At or above 400% of FPL:
(not enough data to produce estimate.)
*Small base sizes
Related Information